Online Analytics & Social Media Metrics
Online Analytics
The following metrics are recommended to use in order to measure the scope and reach of your campaign. Using web analytics and social media analytics, these metrics should be measured continuously throughout the campaign, and up to two weeks after the last campaign post in order to gain a quantitative analysis of your campaign. They can be split into two types of metrics, vanity metrics and impact metrics:
Vanity Metrics
- Number of social media reach of campaign posts
- Number of social media likes
- Number of social media comments
- Number of social media shares
Impact Metrics
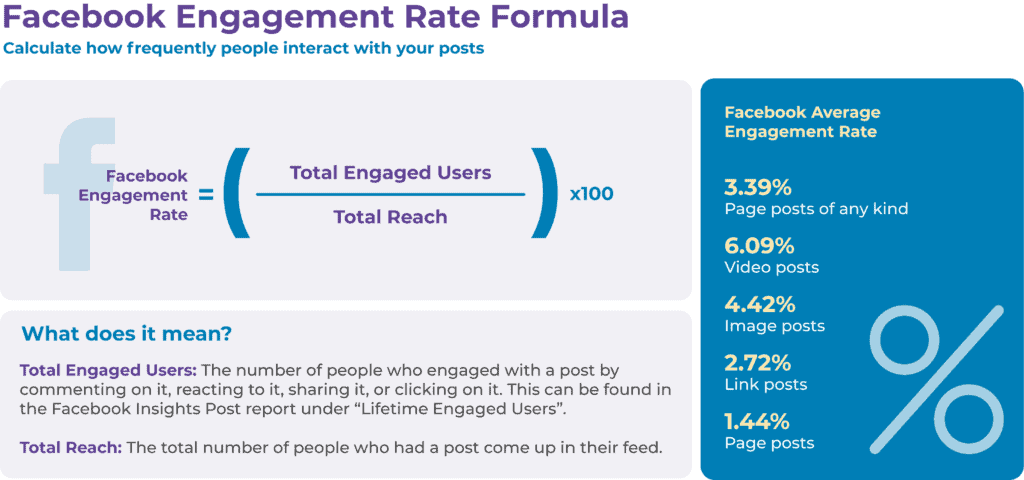
- Engagement rate
- Number of users visiting the campaign website pages
- Price per Click
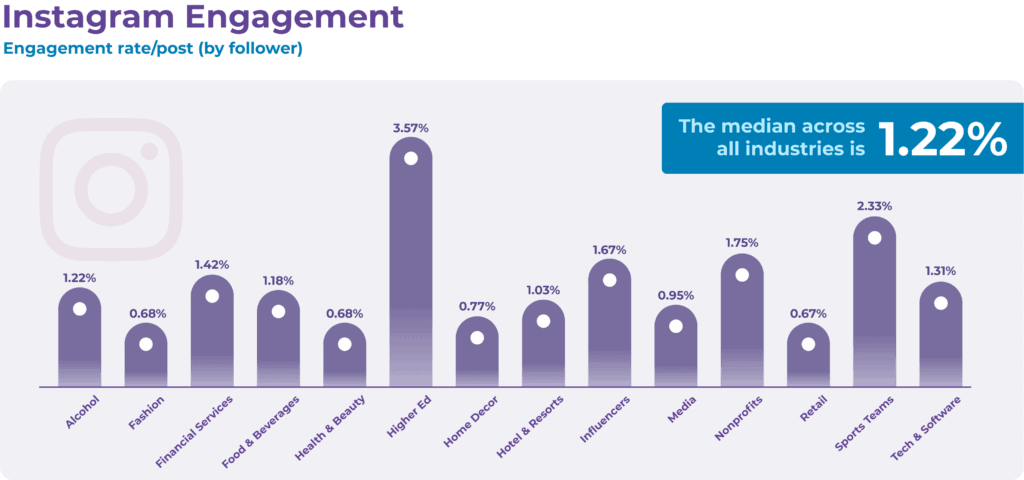
Here are some average engagement rates for Facebook and Instagram:
Below you will find a table with examples of different metrics you can use to measure the scope and reach of your campaign. By using as many of them as possible, you will have a better understanding of how successful your campaign was. Make sure to stay up to date and on top of your measuring by keeping note weekly.
There is a difference between organic and paid posting. Measuring the difference between both could be helpful in order to show what you need to do to grow your platform.
Qualitative Analytics
Remember it is important to also have a qualitative content analysis of your campaign. How do people engage with the campaign? What are they saying in the social media comments on the posts? Can we identify some ‘eye opening’ moments or reactions? Can we identify a change in mindset? These sorts of conversation type questions will help you to create a fuller evaluation of your campaign, and are also known as impact metrics.
Creating an online survey using Survey Monkey, Google survey or a preferred survey toll, within a few days after the closure of the campaign can also be useful to measure the effects of your campaign on the user audience. Ask the audience if they have noticed the title of the campaign, or can recall a message from the campaign. Had they heard of the topic of the campaign before? Has their knowledge on the topic increased since seeing the campaign? Has the campaign changed their view on the topic? Include open questions as well, as these are great for gaining a better understanding of your campaign’s impact and how to improve the campaign next time. Questions such as: could you give an example of how the campaign has influenced your perspective about the topic? Do you think there is anything lacking in this campaign? Keep the surveys short, so as to keep your audience engaged.
Facebook Guidelines

There are dozens of metrics measured on Facebook, about profiles, pages and usage. Although you can measure almost anything that happens on your pages when dealing with campaigns: you definitely should not use this approach. Rather you should look at the aims of your campaigns and target audience to define the key performance indicators that will track the success of the project.
To determine what analytic is most important to your project, you need to define your social media objectives. For example, if you’re trying to raise brand awareness, reach and impressions are the most important. If you want to build a community, engagement is the best measurement to look at. If your goal is to drive users to your website, you should pay attention to traffic and conversions.
- Fans: The number of people who like your page (also known as a Page Like). People who have liked your Facebook page automatically follow it and see your posts in their news feed or their timelines, but they can also choose to unfollow and stop receiving updates.
- Followers: The number of people who see your posts on their timelines. People can follow a page even if they have not liked it.
- Page previews: The number of times people hovered over your page’s name or profile picture to preview your content on Facebook
- Page views: The number of times your profile page has been viewed, by both people logged into Facebook and those who are not.
- Impressions: The number of times any content from your page or about your page entered a person’s screen.
- Actions on page: The number of clicks on your business’s contact information and call-to-action button.
- Engagement: Total number of times someone has interacted or engaged with a post, in the way of clicking its link, sharing on their timeline, leaving a comment or making a reaction. Engagement is one of the most important metrics across social media platforms because it shows if people are interacting with your posts.
- Engagement rate: The number of engagements divided by the number of impressions.
- Impressions: The number of times any content from your Page or about your Page entered a person’s screen.
- Post reach: The number of people who saw any content from your Page page or about your pPage, broken- down by total, organic and promotions. This is one of the most important analytics.
- CTR (Click-through-rate): The percentage of people who see your ad and click through to your landing page.
Twitter Guidelines

Just like Facebook, Twitter also has multiple metrics that can help us understand data and measure impact. The metrics can have different names but similar nature than Facebook ones. However, when looking at Twitter data, one must also take into account the unique features of the platform and bear in mind that Twitter and Facebook can have both overlapping and distinct user groups and habits.
For example, a hashtag is a widely used tool for campaign runners to create and promote a topic and for Twitter users to find information and join the discussion. Therefore, it can be interesting to study how people interact under a hashtag for your analysis. As a page owner or analyst, you may also be interested in metrics such as replies, retweets and quotes as they can tell a lot about people’s interests in and attitudes towards the contents posted on a page. But as much as Twitter data can reveal, you should always define which ones are key indicators based on the form and objective of your Twitter activities as well as the goal and subject of your analysis.
- Impressions: The number of times that a tweet has been viewed (only available for tweets posted within the past 90 days.
- Engagement: The number of times that a user has interacted with a tweet (only available for tweets posted within the past 90 days)
- Following: The number of Twitter accounts followed by the owner of the account/page of interest (hereafter “the owner”).
- Followers: The number of Twitter accounts following the owner. Followers can usually see the activities of the owner on Twitter, unless the owner applies tweet protection to only show tweets to approved followers.
- Replies: The number of comments that people post under a certain tweet or retweet.
- Favorites: The number of times when a tweet is hearted by people. Unlike the other metrics that are somewhat neutral, this clearly indicates favourable attitudes from the viewers of the tweet.
- Retweets: The number of times when a tweet of the owner is re-sent in its original form by people. A tweet can be retweeted by either other users or by the owner itself. In the former case, followers of the retweeting users can see the tweet as well as the author of it –the owner. Because retweeting does not add any commentary contents to the original tweet, it is usually perceived as to imply an interested or approving attitude towards the tweet.
- Quotes: The number of times when a tweet is quoted. Quoting is very similar to retweeting, the only difference being that one can add contents like a comment, viewpoint, clarification or update to the original tweet when quoting it, so that the viewers see both the original tweet by the owner and the contents posted by the quoting party.
- Video views: The number of times a video is 50% in view for at least 2 seconds.
- Media views: The number of times a media content (including videos, vines, gifs, and images) is autoplayed and clicked.
- Media engagement: a count of how many times media such as an image or video in the Tweet has been clicked.
- Hashtag clicks: a count of how many times a hashtag in the Tweet has been clicked.
- Detail clicks: a count of how many times the Tweet has been clicked to see more details.
- User follows: a count of how many times the User (Tweet author) has been followed from this Tweet.
- User profile clicks: a count of how many times the User (Tweet author) has had their profile clicked from this Tweet.
YouTube Guidelines
YouTube video analytics features four main sections: overview, reach, engagement and audience.
Overview
In the overview you’ll find some of the most commonly discussed stats, including watch time, views, and impression. The overview report compiles data from your YouTube channel, the individual videos on your channel, and any engagement from YouTube’s mobile apps.
Here’s a quick summary of the most important watch time analytics on YouTube, and the questions they answer:
- Watch time: how long are people watching my videos? How many views do I have?
- Geography: who’s watching my videos? What countries are my views coming from
- Viewer age: Who’s watching my videos?
- Viewer gender: Who’s watching my videos? Male or female?
- Date: When did people watch my video?
- Traffic sources: where are people discovering my videos?
- Devices: what percentage of my views come from desktop, mobile, or elsewhere?
- Impressions: What is the number of times my content is displayed, no matter if it was clicked or not.
- Impressions click through rate: What is the number of impressions that resulted in a click?
- Subscribers: Number of people or accounts that are subscribed to your channel.
Though Views and Watch time are on the same page, these stats are interdependent. A YouTube video earns one view when it’s watched for 30 seconds or longer. Views are often considered the measure of a video’s success. If you have a high number of organic views, it means your videos are well-optimized and ranking prominently in YouTube’s search pages—which is great! More importantly, if you divide Watch time by total Views, you get an extremely valuable stat: your average view duration.
Watch time ÷ views = average view duration
Average view duration is an extremely important statistic. It can be measured on a per-video basis, or to measure the average amount of time people spend watching videos on your channel as a whole.
If your videos have a high average view duration, it’ll bump your video higher in the search pages and increase the likelihood that your content appears in Suggested and Recommended video lists.
Reach
Analytics now has new metrics to help you better understand your reach on YouTube. This funnel shaped card in the REACH VIEWERS tab shows you how well you’re appealing to potential audiences (Impressions), capturing your audience’s attention (Views), and keeping them watching (Watch time). Depending on where your viewers find your video, you can see data at the channel or video level for each step to better understand how viewers are choosing to watch your videos. In the reach report you will also find the Unique viewers to get a clearer picture of your audience size, or the estimated number of different people who came to watch your video over a given time period. Whether they watch on a computer or mobile, or watch more than once, that person counts as one unique viewer.
Engagement
The engagement report tracks viewer engagement over time. Here, you’ll find your average view duration stats, a list of your best-performing videos, and insights into how your videos stack up against others on YouTube. You will also find the number of likes, dislikes and shares.
If you’re noticing a lack of early engagement, you could:
- Change your thumbnail / video description to more accurately reflect your content
- Remove or shorten a long introduction
- Grab attention by addressing your video topic right away
The most important Interaction metrics include Subscribers, Likes and dislikes, Comments, and Sharing — basically all the ways viewers can tell you directly how they feel about your videos. Looking at this data will show you the best opportunities to reach out and cultivate relationships with your subscribers.
- Likes and dislikes: Watch your likes, dislikes, and comments closely to make sure you’re not losing touch with your audience. Likes and dislikes allow viewers to express themselves with one click. Similar to Views, Likes are a bit of a vanity metric, but the more you have, the better your YouTube SEO ranking will be. You probably don’t want dislikes on your channel, but if they’re balanced by enough likes, it might not be so bad. If your videos deal with polarizing topics, for example, likes and dislikes simply represent people falling on different sides of the fence. To get the clearest sense of the motivations behind likes and dislikes on your videos, you’ll have to drill down into the comments.
- Sharing: Shares are the last major metric of user engagement. Shares are definitely more important than likes, as they show someone cared enough about your video to encourage others to watch it. Click the Sharing service filter to see data on where your videos are being shared. You can also filter by geographical location, device, or date.
Audience
- Demographics: To find out about the people watching your videos—specifically, their age, gender, and geographical location—check Geography, viewer age and viewer gender. Getting to know your audience can help you make more informed, targeted marketing decisions. Or it can help you tap into markets you hadn’t considered previously. Let’s say you have launched your campaign on youtube. You look at analytics, expecting to find a core demographic of 18 to 24 year old men, but discover your audience is actually female-identified people aged 65 and older. Armed with this knowledge, you could adjust the tone of your videos to win back your expected demographic, pivot to your newly-discovered audience, or look for a way to please everyone. Appealing to demographics is important for a bigger reach.
- Traffic sources: Here’s where you’ll find out how people are finding your videos. Did someone find you by using a specific search term? Are you getting a traffic boost after featuring in a prominent YouTuber’s playlist? These are the questions these metrics can help you answer. Examining traffic sources data gives you a more detailed sense of your channel’s reach, whether you’re looking at stats related to paid traffic (e.g., YouTube ads), or organic traffic, (e.g., YouTube’s suggested videos feature).
- Device type: Devices reveal what percentage of your users watch your content on desktop, mobile, tablet, smart TV, or games console.